Title of paper under discussion
Enhanced Pitch Sensitivity in Individuals with Autism: A Signal Detection Analysis
Authors
Anna Bonnel, Laurent Mottron, Isabelle Peretz, Manon Trudel, Erick Gallun and Anne-Marie Bonnel
Journal
Journal of Cognitive Neuroscience, vol 15, no 2, pp 226–235
Link to paper (free access)

Overview
Building on previous research showing that people with autism are especially good at memorising picture-pitch associations, detecting pitch change in melodies and “chord disentangling”, this team of scientists from the University of Montréal set out to discover if such “superiority might be due to an abnormally high sensitivity to fine-grained pitch differences in sounds.”
12 ‘high-functioning’ people with autism and 12 ‘neurotypical’ people, all musically untrained, were given two tasks: 1) to listen to a series of consecutive pairs of tones, and to judge after each pair whether the two tones were ‘same’ or ‘different’ in pitch and 2) to listen to a series of two slightly differently pitched tones – ‘high’ and ‘low’ – played over and over at random and to judge after each tone whether it was high or low.
People with autism proved more pitch sensitive than the ‘neurotypical’ controls in both tasks, especially the second. These results mirror findings of “enhanced visual performance” in tests by people with autism, supporting a more general “enhanced perceptual functioning” model to describe “peaks of ability in autism”.

Method
12 participants with high-functioning autism and 12 control ‘neurotypical’ participants of matching age and IQ were chosen for the study. “No musical experience” was a criterion for selection as variable amounts of musical expertise amongst the participants could have skewed the analysis.
Hearing tests were carried out to ensure everyone had normal hearing; they incidentally revealed that the participants with autism were no better than the control participants at perceiving quiet tones, across all pitches.
Two tasks were then presented:
Task One – pitch discrimination
A series of pairs of consecutive tones were played to participants. In a pair, the frequency (pitch) of the first tone was either 500, 750, 1000 or 1500 Hz. The second tone of the pair was either identical to the first, or slightly higher in pitch (by either 1%, 2% or 3%). After hearing each pair the participant was asked 1) to indicate whether the two tones were the ”same” or “different” and 2) how confident they were (high, medium or low) that their ‘same’/‘different’ judgment was correct.
Task Two – pitch categorisation
Participants listened to a series of two slightly differently pitched tones repeated over and over in random sequence, one ‘low’ (1000 Hz) and one ‘high’ (1030 Hz). After each tone, during the series, the participant was asked to nominate if that tone was ‘high’ or ‘low’. They then listened to a second series and were asked to complete the same task, this time a bit more difficult because the two tones were closer, 1000Hz and 1020 Hz. And then a third, even more difficult, with the tones pitched at 1000Hz and 1010Hz. Again the participants always gave a confidence rating alongside each answer of high, medium or low.

Revealing sensitivity despite bravado – Signal Detection Analysis
In trying to discern how sensitive each participant was to pitch differences, the researchers used a method of analysis that is able to measure such sensitivity independently of the ‘confidence’ of the participant making the calls, a method called signal detection analysis. The idea behind the method – developed in the 1940’s for rating how well operators could discern enemy aircraft from radar pictures – is that when people make a decision on a binary choice such as “same/different” or “high/low” they do it not only based on their perceptual ‘sensitivity’ to spotting that difference, but also depending on the conviction and confidence (‘decision criteria’) with which they make the call. For instance someone might be keener to reckon they’ve spotted a ‘difference’ than others, even though they are no more sensitive. In order to tease out ‘sensitivity’ (the parameter under investigation) from ‘decision criteria’ Bonnel and her colleagues fed the data from each task – the correct answers, the wrong answers and the confidence with which each had been decided – into a graphic called a Receiver Operating Characteristics (ROC) curve. From this graphic a genuine pitch sensitivity reading could be revealed for each participant, irrespective of any ‘response bias’ inherent in their answers.
ROC curve analysis is explored in more depth here.

Results
Task One – pitch discrimination
The percentage of correct answers closely matched the confidence ratings of the participants across both groups, and the lower the confidence rating the longer participants took to make a decision.
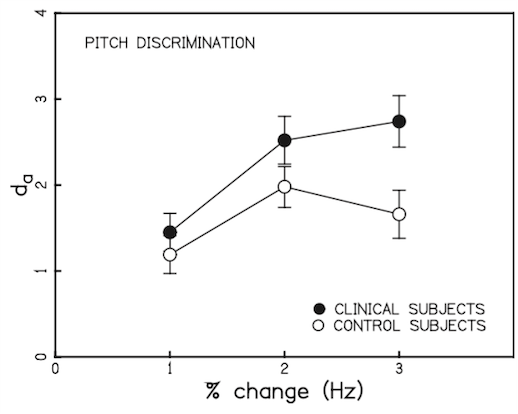
There was no significant difference between ‘clinical participants’ (people with autism) and ‘control participants’ (‘neurotypical’ people) in sensitivity to a 1% different in pitch. But when that difference was 2% or 3% the sensitivity of clinical participants outshone that of the controls:
Task Two – pitch categorisation
Again, response accuracy closely followed the confidence ratings; and the lower the confidence levels, the longer it took participants to make their judgment.
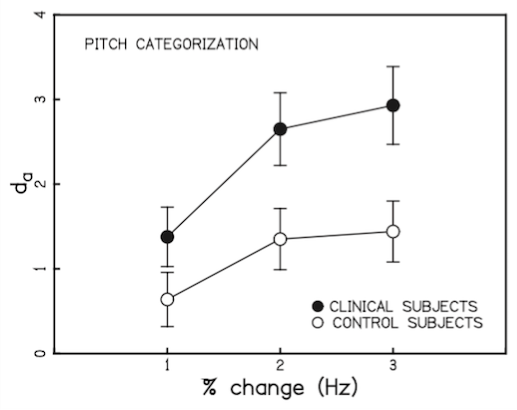
Sensitivity to pitch difference was higher amongst the clinical participants compared with the control partisans in all three series (pitch differences of 1%, 2% and 3%):
Comparison between the two tasks
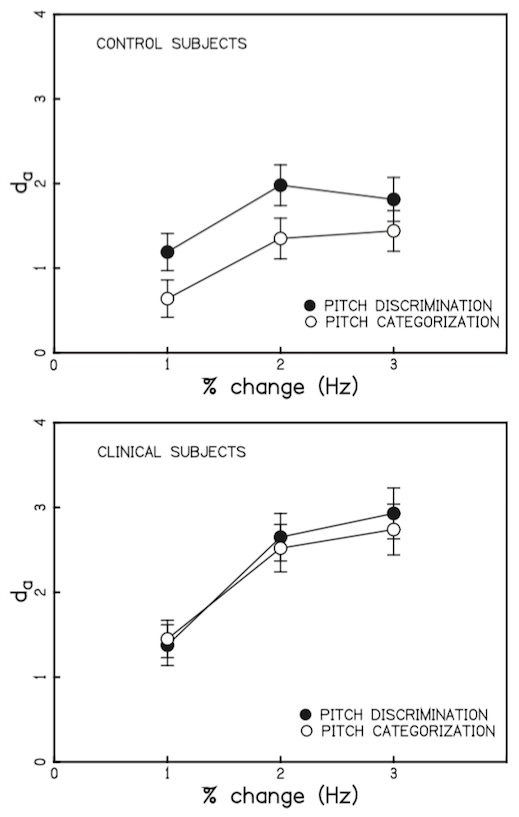
In ‘neurotypical’ participants (‘control subjects’), pitch discrimination was significantly better than pitch categorisation. But in participants with autism (‘clinical subjects’), performance was equally as impressive in both tasks:
Discussion
This study was the first ever “to apply signal methodology technology to investigate perceptual performance of individuals with autism” and its authors concluded their findings “demonstrate superior “pitch sensitivity” in high-functioning individuals with autism.”
Bonnel suggests that figure 5 (above, showing the similarity in sensitivity displayed in both tasks by individuals with autism, compared with the lower sensitivity in Task Two cf Task One by ‘neurotypical’ participants) may reveal a difference in strategy between the two groups in carrying out Task Two. Namely that the clinical participants are able to use ‘trace memory’ for Task One and Task Two, whereas control participants can use ‘trace memory’ for Task One but find it is not robust enough for the challenge of Task Two, and instead have to switch to a “contest-coding” type of memory.

She goes on to argue that these results suggest people with autism excel at distinguishing pitch changes in a melodic contour (and similar skills in visual discrimination) not due to compensation for a weakness in ‘global’ processing (as postulated by the “Weak Central Coherence model”), but due to superior strength in ‘local’ processing.
Such results, demonstrating as they do a superior ability to process “fine-grained, long-term representations of differential pitches”, could also explain the higher incidence of Absolute Pitch in people with autism.
Although this paper doesn’t itself investigate brain activity associated with pitch sensitivity, Bonnel is keen to point out that a comparison of electroencephalogram (EEG) recordings taken whilst children with and without autism listened to unexpected pitch changes suggests “a reorganisation of pitch processing at a cortical level in individuals with autism”.
Crucially, the authors emphasise that their findings, taken together with similar research into visual discrimination by people with autism, suggest that such superior discriminatory ability stems from “enhanced perceptual functioning”; and the fact that these participants were all ‘normal IQ’ further supports the theory that “the peaks of abilities in pitch perception in autism are not “relative” to otherwise impaired performance but rather are “absolute” peaks of abilities.”

Coda
Symphony no 40 in G minor, K550 by WA Mozart
Staatskapelle Berlin, cond Julien Salemkour